
EPA Updates Signs of Climate Change
Air Date: Week of May 21, 2021
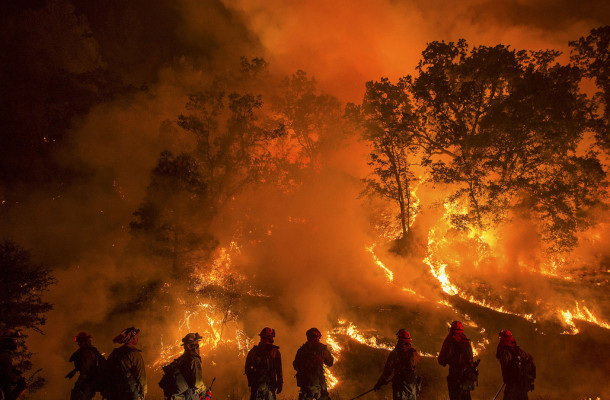
Firefighters battle the Valley Fire in California, 2015. Wildfires are one of the 54 metrics tracked in the EPA climate data. (Photo: Jeff Head, Flickr, Public Domain)
The US Environmental Protection Agency recently unveiled an updated set of climate change indicators after a four-year gap under the Trump administration. These data, collected by other government agencies and compiled on the EPA’s website, range from coastal flooding and wildfires, to longer allergy seasons. Senior climate scientist at the Union of Concerned Scientists Kristina Dahl joins Host Bobby Bascomb to discuss what this climate resource means for policymakers and local communities alike.
Transcript
BASCOMB: From PRX and the Jennifer and Ted Stanley Studios at the University of Massachusetts Boston, this is Living on Earth. I’m Bobby Bascomb.
The Environmental Protection Agency recently unveiled a newly updated database of climate change indicators after a four-year gap under the Trump administration. These indicators, collected by other agencies and compiled on the EPA’s website, range from coastal flooding and wildfires, to longer allergy seasons. They paint a picture of a rapidly warming climate that is already impacting American lives. For more, I’m joined now by Kristina Dahl, a senior climate scientist with the Union of Concerned Scientists. Kristina, welcome to Living on Earth.
DAHL: Thank you so much for having me.
BASCOMB: Now, this dataset includes many indicators of the climate crisis. How many were there? And can you briefly give us an idea of some of the things that were studied here?
DAHL: Sure. So, there are about 54 indicators of climate change that the EPA is tracking. EPA has maintained this website since about 2010 or so, with a notable break during the Trump administration. About a dozen of the indicators that they're now tracking are new, and they cover a whole range of different things. So you can see how things like US greenhouse gas emissions have been changing over time, how the temperature has been changing over time. And so there's the sort of basic climate change things to track. But then there's some really interesting ones, like the number of heat related deaths in the country, or residential energy use. And all of those are different views into how climate change is altering the earth system, but also our day to day lives. And, you know, the weather we come to rely on.
BASCOMB: You know, many of the indicators highlighted in this dataset really kind of explained some of the changes that we're already seeing. To what degree do you think this information sort of validates our lived experiences?

The East Pierhead Lighthouse in Michigan city stands surrounded by ice. Great Lakes ice cover is amongst the dozen new indicators included in the updated climate data. (Photo: Tom Gill, Flickr, CC BY 2.0)
DAHL: I think over the last decade or so people have begun to really notice the changes in the climate around them. For example, people living on the coasts and in particular, on the eastern seaboard of the US, have noticed an increase in the number of coastal floods each year. And these floods can happen even just during a sunny day when there's an extra high tide. And the data that is presented here really makes it clear that those changes are real, they're happening, and they're the result of sea level rise. I think that the data that's presented here really do show this picture, that brings data to what people are already experiencing and noticing. And hopefully, this data starts to connect the dots so that people say, Oh, this isn't just a strange thing that I've noticed over the last few years, no, this is the result of climate change.
BASCOMB: And was there anything in here that really struck you in particular?
DAHL: So for people who have been following the data on climate change, and who monitor headlines, there may not be anything here that's terribly surprising. But what's really impactful here, I think, is seeing it all together in one place. Usually, when scientists compile all of the information about climate change, it'll come out in a really wonky assessment, very technical, it's very dense. And it's not necessarily geared toward the average reader. What this EPA site is a place that compiles all that data in a really user friendly way. So each of their indicators has a nice accessible chart that goes along with it that's clear and relatively easy to read. So it's really a valuable clearing house that anyone can access for this kind of information.
BASCOMB: Was there any data that was missing here, in your opinion, or something that they should be looking at that they're not at this point?

Ragweed is a common allergen, and climate change is extending the length of the ragweed pollen season. Graphs and maps illustrating this phenomenon are available on the EPA climate indicators website. (Photo: Dendroica cerulea, Flickr, CC BY 2.0)
DAHL: I know that the EPA is hoping to add indicators over time. So hopefully, this isn't, you know, a set that we will see unchanging for the next few years. But I do think that there are things that they could add that would additionally speak to the changes, people are noticing. You know, one in particular that strikes me is related to hurricanes or tropical cyclones, we know that there are some really fascinating and destructive trends happening with hurricanes. And that's relatively recent data. But we now know, for example, that there's been an increase in the number of category four and five storms in the Atlantic Ocean. We also know that climate change is causing more of those storms to intensify rapidly. And that's important because as communities are trying to prepare for landfall for a hurricane like that, they need to know what kind of storm they're dealing with. I think that EPA would be a great place to compile some of that latest research and to present it back to the public so that they could see and understand that those changes that they're seeing in hurricanes, for example, are related to climate change.
BASCOMB: So this type of information was not made publicly available by the previous administration. Was it still being collected, though? I mean, did scientists still have access to this type of data?
DAHL: Yes, so most of the data that you will see on the EPA climate change indicators website is actually collected by other government agencies. So those agencies continued to collect the data. And if you had wanted to dig around on NOAA's website, or CDC 's website, you'd be able to find it somewhere. But EPA has really always been the clearing house for this information. And so it is playing that important role of putting it all in one place.
BASCOMB: And why do you think it's important to have it all in one place?
DAHL: So EPA has been tasked with regulating carbon dioxide as a pollutant. So it's important that EPA collect this data because we can't monitor or regulate something that we can't measure. So it is important for EPA to have this information collected, make sure it's a central part of the agency's work, so that it can do its broader work of trying to regulate CO2 as a pollutant.
BASCOMB: And for the public, I mean, what can they do with this information now that it is available in a more user friendly way?

The population of Black Guillemots in Alaska is one of the local datasets included in the EPA data. These birds depend on rapidly shrinking arctic sea ice. (Photo: Brian Gratwicke, Flickr, CC BY 2.0)
DAHL: There's a lot that communities could do here. And especially if you're living in a community where there's maybe not a lot of local support for collecting climate data, or you know, local energy around trying to push for climate action, anyone can access this data, you can look and see how something like temperature in your area has been changing over time, or how coastal flooding has been changing over time. And that may be useful information if you are trying to get your town to act on climate change. And this will help to show why, right? We're having these changes happening. They're affecting everybody's lives. And by having access to this data, people in any community can show the consequences of climate change. I think there are also some really interesting case studies here that could be inspiring to other communities. For example, there's indicators and stories around Great Lakes ice cover, or looking at a particular species of bird on Cooper Island in Alaska. And so looking at these kind of community level indicators, it could be inspiring to people who are saying, well, let's catalogue what's going on in our town, or we may have some source of data locally that's not widely available that would be interesting to incorporate into this website. So, I think there are a lot of opportunities for people to kind of connect with this data and hopefully use it for greater good.
BASCOMB: Kristina Dahl is a senior scientist for the Union of Concerned Scientists. Kristina, thank you so much for taking this time with me today.
DAHL: Thank you so much for having me. It's been lovely
Links
Climate Change Indicators in the United States at the Environmental Protection Agency
The New York Times | “Climate Change Is Making Big Problems Bigger”
Bloomberg | “U.S. EPA Issues First Climate Data Update Since 2016”
Living on Earth wants to hear from you!
Living on Earth
62 Calef Highway, Suite 212
Lee, NH 03861
Telephone: 617-287-4121
E-mail: comments@loe.org
Newsletter [Click here]
Donate to Living on Earth!
Living on Earth is an independent media program and relies entirely on contributions from listeners and institutions supporting public service. Please donate now to preserve an independent environmental voice.
NewsletterLiving on Earth offers a weekly delivery of the show's rundown to your mailbox. Sign up for our newsletter today!
![]() Sailors For The Sea: Be the change you want to sea.
Sailors For The Sea: Be the change you want to sea.
 The Grantham Foundation for the Protection of the Environment: Committed to protecting and improving the health of the global environment.
 Contribute to Living on Earth and receive, as our gift to you, an archival print of one of Mark Seth Lender's extraordinary wildlife photographs. Follow the link to see Mark's current collection of photographs.
 Buy a signed copy of Mark Seth Lender's book Smeagull the Seagull & support Living on Earth
© Copyright World Media Foundation. All Rights Reserved
Home | Contact | RSS | Donate | Newsletter