
Oberlin Environmental Dashboard
Air Date: Week of June 28, 2013
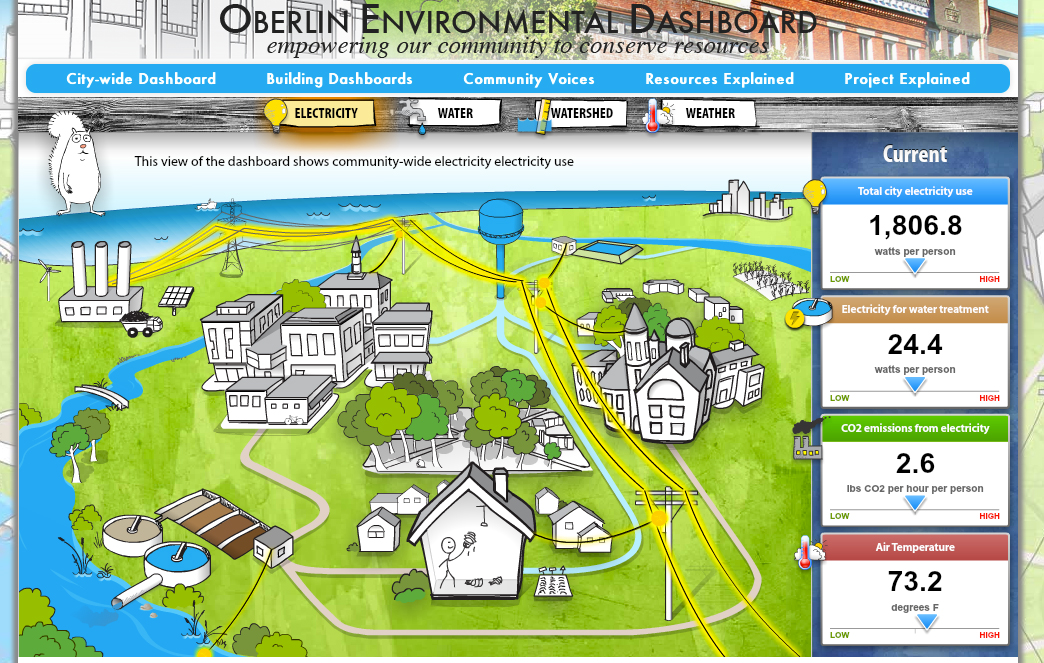
Oberlin City-wide Dashboard (Photo: oberlindashboard.org)
Technologies for creatively displaying energy and water use have grown quickly over the past decade, but most focus on resource use at the individual or building level. A new website applies this approach to the entire town of out of Oberlin, Ohio. The Oberlin Environmental Dashboard hopes to become a model for community-level resource conservation. Host Steve Curwood speaks with John Petersen, Professor of Environmental Studies at Oberlin and creator of the Oberlin Environmental Dashboard.
Transcript
CURWOOD: They say that a picture's worth a thousand words - and the city of Oberlin, Ohio, has taken that to heart. It's pioneering a new website that uses entertaining graphics to show the entire town’s electricity use, water flow, and even water quality - all in real time. The developers call it the Oberlin Environmental Dashboard, and hope it will become a model for motivating community wide energy conservation, not just in Oberlin, but across the region. Jon Petersen teaches Environmental Studies at Oberlin College, and is one of the developers. And I went to see him to find out exactly what an environmental dashboard is.
PETERSEN: Well, an environmental dashboard is basically a technology and an approach taking information about resource flows that take place in the world around us and translating that into a form that’s easily accessible to people who might not be so technical, so that they can understand the ways in which they’re engaging with resource flows and their decision making process.
CURWOOD: In other words, every picture tells a story?
PETERSEN: That’s absolutely right. We’re trying to create these sort of compelling animated graphics that convey to people in a way how their resource consumption is actually affecting the world around them.
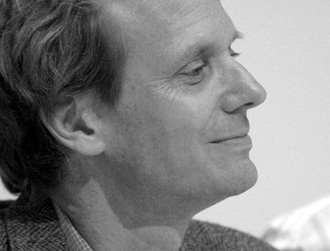
Professor John Petersen (Photo: Oberlin College)
CURWOOD: So what’s different about the Oberlin dashboard project that’s different from other visual displays people have tried?
PETERSEN: So a lot of people out there are beginning to develop new technologies to monitor and display energy flows, electricity flows in buildings. And there’s been some really neat developments along that line in the last 10 years. What separates what we’re doing from what other people are doing is that we’re trying to monitor not just resource flows in individual buildings, but resource flows at the whole community scale as well as environmental quality.
CURWOOD: Well, let’s go online and take a look at your site. And if you’re at home listening and you want to do this too - it’s OberlinDashboard.org.
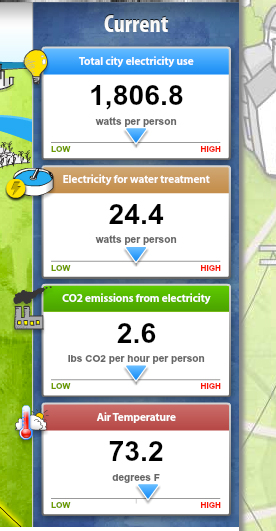
Sidebar showing town’s electricity use (Photo: oberlindashboard.org)
[TYPING ON KEYBOARD]
CURWOOD: OK. Let’s take a cruise through here. So, what are we seeing here, Jon?
PETERSEN: This is the citywide dashboard you’re looking at. Basically, what we’ve tried to do is create an animated cartoon model of a community. So you’re looking at the freshwater treatment plant, the wastewater treatment plant, the electricity production facility, the river that drains our community. And you’re watching electrons flow down power lines; you’re watching water flow down pipes through this model...
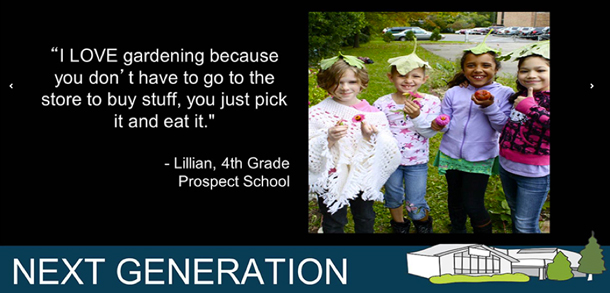
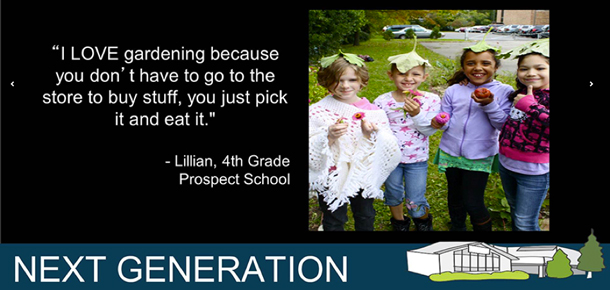
Community Voices features local schoolchildren (Photo: oberlindashboard.org)
CURWOOD: And there’s black smoke coming from the power plant.
PETERSEN: [LAUGHS] There is black smoke coming from the power plant. Well, like many communities in the mid-west, we’re still getting a lot of our power from coal fired power plants. But you also, if you look closely you see there spinning wind turbine, and you see a solar panel there, we’re getting our power from those too.
PETERSEN: And let’s go to straight water here. Alright, so now what we’re looking at is how many gallons per person is being used within Oberlin right now. So I’m seeing 2.2. gallons. That’s not a whole lot of water being used per person per hour, but that’s going to change over the course of the day. So if you look at that in the morning, you’re going to see high use because people are taking showers. There are times of day when our little bit of light industry within Oberlin is going to be using more water.
Community Voices (Photo: oberlindashboard.org)
CURWOOD: Let’s look at electricity...total electricity city use watts per person. It’s almost 2,000 watts per person right now.
PETERSEN: Yes, that’s a very large number. You have to consider with a number like that is, that’s including the industry we have in Oberlin. But it does give you a sense of what’s the sort of amount of total energy that’s being used to support the whole community.
CURWOOD: So tell me what are the values we’re seeing on the right hand side?
PETERSEN: We’re looking at water quality right now, for instance. So you’re seeing how deep the water is in the local river, so that’s going to change based on when the last rainstorm was. You’re looking a dissolved oxygen, you’re seeing turbidity - that’s how much cloudiness is in the water. So that’s telling me about how much soil is running off from agricultural fields, and you’re seeing PH, which is also a basic indicator of water health.
CURWOOD: So far, what’s been the response from the Oberlin community to this?
PETERSEN: I think our best response has really been among school-aged children. Part of that is...one of our displays is very prominently located in the hall of Prospect Elementary, which is a three through five public school. And we do actually see children as being central to this process. Not just as recipients of information, but one of the things that we’re most excited about with environmental dashboard, is the community voices section where we’re taking images, and messages drawn from community members and displaying them to the community. So the feedback is not just about telling you how much resources you’re consuming but it’s about asking you, ‘what are you doing, what are you thinking? How you think the world should be in the future?’ And so, when we take the voices of children and images of children, we find that they have a particularly powerful resonance with the rest of the community.
CURWOOD: Alright, let’s click on ‘community voices’. So here’s a kid at Prospect School. What does he say?
PETERSEN: ‘When we went to Plum Creek, we measured dissolved oxygen. There needs to be oxygen so, just like us, fish and other organisms can breathe’.
PETERSEN: You know, that’s probably a kid that’s not spent a whole lot of time at Plum Creek, our little stream, before. He goes down there, he makes this sort of realization about something that’s important to organisms in the world. And then we find a way to put that up on a screen and celebrate that realization.
CURWOOD: Here’s Lillian, fourth grader at the Prospect School.
PETERSEN: ‘I love gardening because you don’t have to go to the store to buy stuff. You just pick it and eat it’.
CURWOOD: I’m with Lillian.
PETERSEN: [LAUGHS] So am I.
CURWOOD: How do you hope people will use the dashboard?
PETERSEN: Well, our goal ultimately is to change people’s thinking and behavior. But when we think about behavior change, we not interested in just people turning off lights, but we’re interested in helping people to understand their decisions in the context of the community. So we’re just as interested in having people think about how they are interacting with other community members, how they’re voting in local elections. We want them to think about all of those things as they relate to resource use. But when people look at the dashboard, immediately what we’re most interested in is engaging them. So we need to engage, educate, motivate and empower them to make decisions in their lives which are consistent with the kinds of changes we need to make to bring about a more sustainable relationship between humans and the rest of the natural world.
CURWOOD: Jon Petersen is Professor of Environmental Studies at Oberlin College. Thanks for taking the time today, Jon.
PETERSEN: It’s been my pleasure. Thank you so much, Steve.
Links
Living on Earth wants to hear from you!
Living on Earth
62 Calef Highway, Suite 212
Lee, NH 03861
Telephone: 617-287-4121
E-mail: comments@loe.org
Newsletter [Click here]
Donate to Living on Earth!
Living on Earth is an independent media program and relies entirely on contributions from listeners and institutions supporting public service. Please donate now to preserve an independent environmental voice.
NewsletterLiving on Earth offers a weekly delivery of the show's rundown to your mailbox. Sign up for our newsletter today!
![]() Sailors For The Sea: Be the change you want to sea.
Sailors For The Sea: Be the change you want to sea.
 The Grantham Foundation for the Protection of the Environment: Committed to protecting and improving the health of the global environment.
 Contribute to Living on Earth and receive, as our gift to you, an archival print of one of Mark Seth Lender's extraordinary wildlife photographs. Follow the link to see Mark's current collection of photographs.
 Buy a signed copy of Mark Seth Lender's book Smeagull the Seagull & support Living on Earth
© Copyright World Media Foundation. All Rights Reserved
Home | Contact | RSS | Donate | Newsletter